How to Use Anti-Counterfeit Data to Improve Your Distribution Strategy
For years, product authentication systems have been deployed with a singular objective: to identify fakes and protect the brand. The logic is straightforward. A customer scans a code, the system verifies the product, and the brand either confirms authenticity or flags a counterfeit.
But this narrow view leaves immense value untapped.
Every scan, every failed verification, every repeat interaction creates a layer of intelligence that goes far beyond product authentication or anti-counterfeiting solutions. When interpreted correctly, authentication scan data becomes a powerful lens into how your supply chain management actually functions in the real world, not just how it is reported on paper.
In an environment where the global QR ecosystem is projected to exceed $12 billion with over 11 billion scans annually, brands are sitting on one of the richest sources of first-party data available today. Yet most continue to use it defensively.
The shift that leading organisations are making is subtle but transformative. They are no longer asking, “Where are the fakes?” Instead, they are asking, “What is this data telling us about how our products move, sell, and get diverted?”
This is where authentication data becomes business intelligence.
Beyond Yes or No: What Authentication Scan Data Really Contains
A typical product verification scan is often misunderstood as a binary event. Genuine or fake. Valid or invalid.
In reality, each scan carries multiple layers of metadata:
1. Geographic Coordinates
Every scan reveals where the product is being verified. At scale, this creates a highly granular map of product presence, often down to pin code level.
2. Timestamp Patterns
The time of the scan indicates buying cycles, consumption behaviour, and even regional demand patterns.
3. Device Intelligence
The type of device, operating system, and scan method offer insights into user demographics and engagement levels.
4. Scan Sequences
Repeat scans, first-time scans, and scan frequency patterns reveal whether a product is being handled by a consumer, distributor, or potentially a counterfeiter.
When layered together, this becomes a living, breathing dataset that reflects real market behaviour. Unlike sales reports or distributor claims, this data is not filtered or delayed.
It is direct, unstructured, and highly revealing.
The Four Distribution Questions Your Scan Data Can Answer

Traditional track-and-trace systems provide structured visibility across logistics operations. However, they often depend on compliance from intermediaries. Authentication data, on the other hand, is independent and behaviour-driven.
There are four critical questions it can answer without a field audit.
1. Where Is My Product Actually Being Consumed?
Your distributor may report sales in Karnataka, but scan data might reveal significant activity in Maharashtra or even across borders.
This discrepancy indicates diversion.
In industries such as pharma, where regulatory frameworks like DSCSA and EU FMD demand strict traceability, such mismatches can lead to compliance risks as well as revenue leakage.
2. Are My Distribution Channels Aligned With Demand?
Scan density across regions shows whether product availability matches actual consumption.
If high scan activity appears in low-supply regions, it indicates stock shortages or grey market inflow. Conversely, low scan activity in high-supply regions suggests overstocking.
This is where product traceability begins to intersect with demand planning.
3. Which Channels Are Driving Genuine Customer Engagement?
Not all sales channels are equal.
Scan data can differentiate between:
Consumer-driven scans
Retailer-initiated scans
Suspicious bulk scanning behaviour
This allows brands to identify which channels contribute to customer satisfaction and which merely move inventory without engagement.
4. Where Are the Early Signals of Risk?
Clusters of unusual scan behaviour often appear weeks before formal complaints or market escalations.
This early warning system is particularly valuable in sectors like FMCG, electronics, and pharmaceuticals where product safety and brand trust are critical.
Scan Clustering: The Truth About Product Movement
One of the most powerful analytical tools in authentication data is clustering.
When scan data is grouped by geography and frequency, patterns begin to emerge.
What Clustering Reveals
High-density scan regions indicate consumption hotspots
Unexpected clusters highlight diversion or parallel trade
Sparse but repeated scans can indicate counterfeit testing zones
For example, if a batch assigned to a distributor in South India shows heavy scan activity in North India, it suggests unauthorised redistribution.
This is not just a brand protection issue. It is a distribution inefficiency.
In many cases, brands discover that up to 15–25% of their inventory is being diverted outside intended channels. This leads to pricing inconsistencies, channel conflict, and reduced profitability.
Failed Scans: The Most Ignored Intelligence Signal
Most organisations treat failed authentication scans as isolated incidents.
They are anything but.
A single failed scan may not mean much. But a cluster of failed scans in a specific geography is a strong signal.
What It Could Indicate
Counterfeit products are entering that market
Expired or tampered goods are being resold
Grey market imports bypassing authorised channels
In the context of trademark protection and IP protection, these signals are critical.
For instance, a spike in failed scans in export markets could indicate non-compliance with regulations like EUDR or local traceability mandates.
More importantly, it reveals where enforcement efforts should be focused.
Scan Velocity: A Predictor of Demand and Diversion
Scan velocity refers to the rate at which products are being scanned over time.
This metric is often overlooked, yet it is one of the strongest indicators of real-time demand.
How It Helps
Demand Forecasting: High scan velocity correlates with fast-moving inventory
Stockpiling Detection: Sudden spikes followed by silence indicate hoarding or diversion
Seasonal Trends: Patterns emerge across festivals, climate conditions, and regional buying cycles
For example, in temperature-sensitive goods or regulated sectors like pharma, abnormal scan velocity can indicate panic buying or supply disruptions.
Brands that integrate this data into their forecasting models report significantly improved accuracy compared to traditional sales-based predictions.
Read on How Cooperative Brands Like Amul Protect Against Counterfeiting
The Inventory Black Hole: Reconciling Scan Data With Sales
One of the most persistent challenges in supply chain management is the “inventory black hole.”
Products are dispatched, invoiced, and recorded as sold. But their actual journey remains unclear.
This is where reconciliation becomes essential.
The Reconciliation Exercise
By comparing:
Sales data from ERP systems
Distributor-reported inventory
Authentication scan data
brands can identify discrepancies such as:
Products sold but never scanned
Products scanned in regions with no reported sales
High scan activity without corresponding revenue
These gaps often point to leakage, unauthorised redistribution, or inefficiencies in track and trace systems.
Studies indicate that organisations implementing such reconciliation processes reduce shrinkage by up to 20–30%.
From Security Tool to Intelligence Engine
The real transformation happens when brands stop treating authentication as a standalone function and integrate it into broader analytics.
This requires building a distribution intelligence framework.
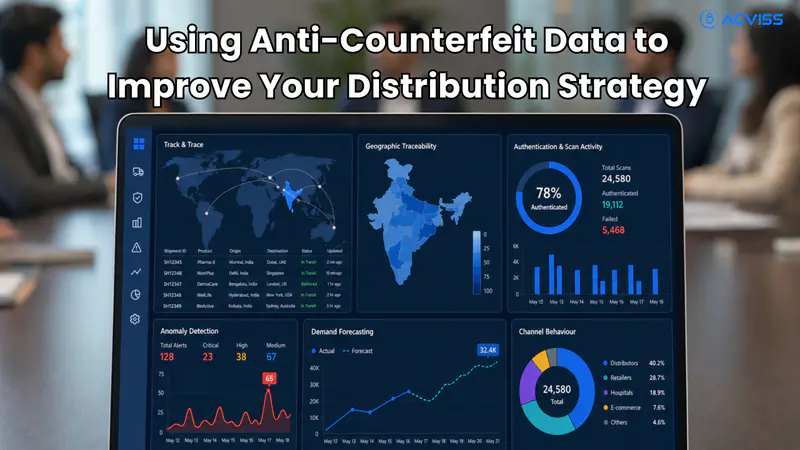
Building a Distribution Intelligence Dashboard

Modern brand authentication platforms already capture the required data. The missing piece is structured interpretation.
A comprehensive dashboard should include:
1. Authentication & Scan Activity
Total scans vs unique scans
Success and failure ratios
Repeat scan patterns
2. Geographic Traceability
Scan density by region
Unexpected market presence
Cross-border activity
3. Anomaly Detection
High-frequency scans on single codes
Clusters of failed verifications
Sudden spikes in activity
4. Channel Behaviour
Distributor-level engagement
Retailer vs consumer scans
Channel-specific performance
5. Demand and Forecast Indicators
Scan velocity trends
Seasonal patterns
Regional demand shifts
When combined, these dashboards turn raw QR verification data for the supply chain into actionable intelligence.
The Role of Non-Cloneable Technology in Data Integrity
None of this intelligence is reliable without trust in the underlying data.
This is where non-cloneable technologies, such as those enabled by Certify, play a crucial role.
Unlike standard QR codes, non-cloneable labels ensure that each scan corresponds to a unique physical product. This eliminates duplication, reduces false positives, and enhances the accuracy of product authentication market intelligence.
Combined with track and trace systems, this creates a robust framework where physical products and digital records are tightly linked.
For industries dealing with high-value goods, regulated exports, or sensitive categories like pharmaceuticals, this is not optional.
It is foundational.
A Shift in Mindset: From Protection to Optimisation
The evolution of anti-counterfeiting solutions is moving towards a broader strategic role.
Authentication is no longer just about defending the brand. It is about understanding the market.
When used correctly, scan data can:
Reveal inefficiencies in distribution
Improve inventory planning
Enhance customer engagement by understanding behaviour
Strengthen compliance with global regulations
Drive better decision-making across sales and operations
This aligns with the broader shift towards data-driven supply chain traceability and digital transformation.
The Intelligence Is Already in Your System
Most brands already have authentication systems in place.
They already collect scan data.
They already invest in brand protection solutions.
The opportunity lies not in collecting more data, but in asking better questions of the data they already have.
Distribution challenges are rarely visible in spreadsheets or distributor reports. They become visible when real-world behaviour is captured and analysed.
Authentication data provides exactly that.
It tells you where your product travels, how it is handled, and where your system breaks down.
Ignoring this intelligence means continuing to operate with blind spots.
Using it effectively turns your authentication system into one of the most powerful business intelligence tools in your organisation.
Interested in learning more? Get in touch with us to explore how authentication data can transform your distribution strategy and strengthen your brand.